OEE Software
Track, Analyze, and Improve Your OEE
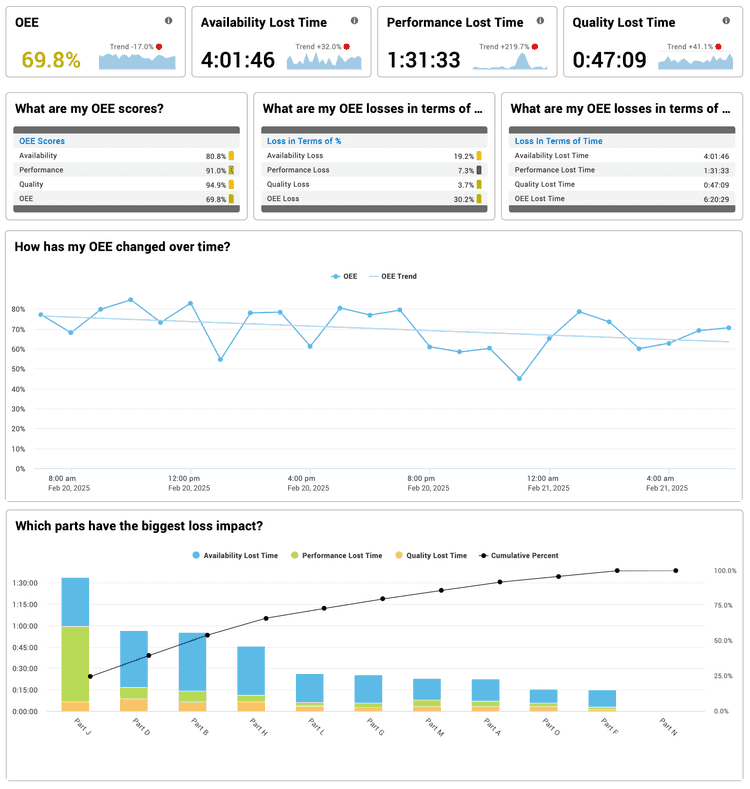
An effective OEE software system gives you the tools to make impactful, data-driven decisions. Stop flying blind — gain real-time visibility into key production metrics and access historical data that’s intuitive, visual, and action-oriented.
Start Your Free OEE System Trial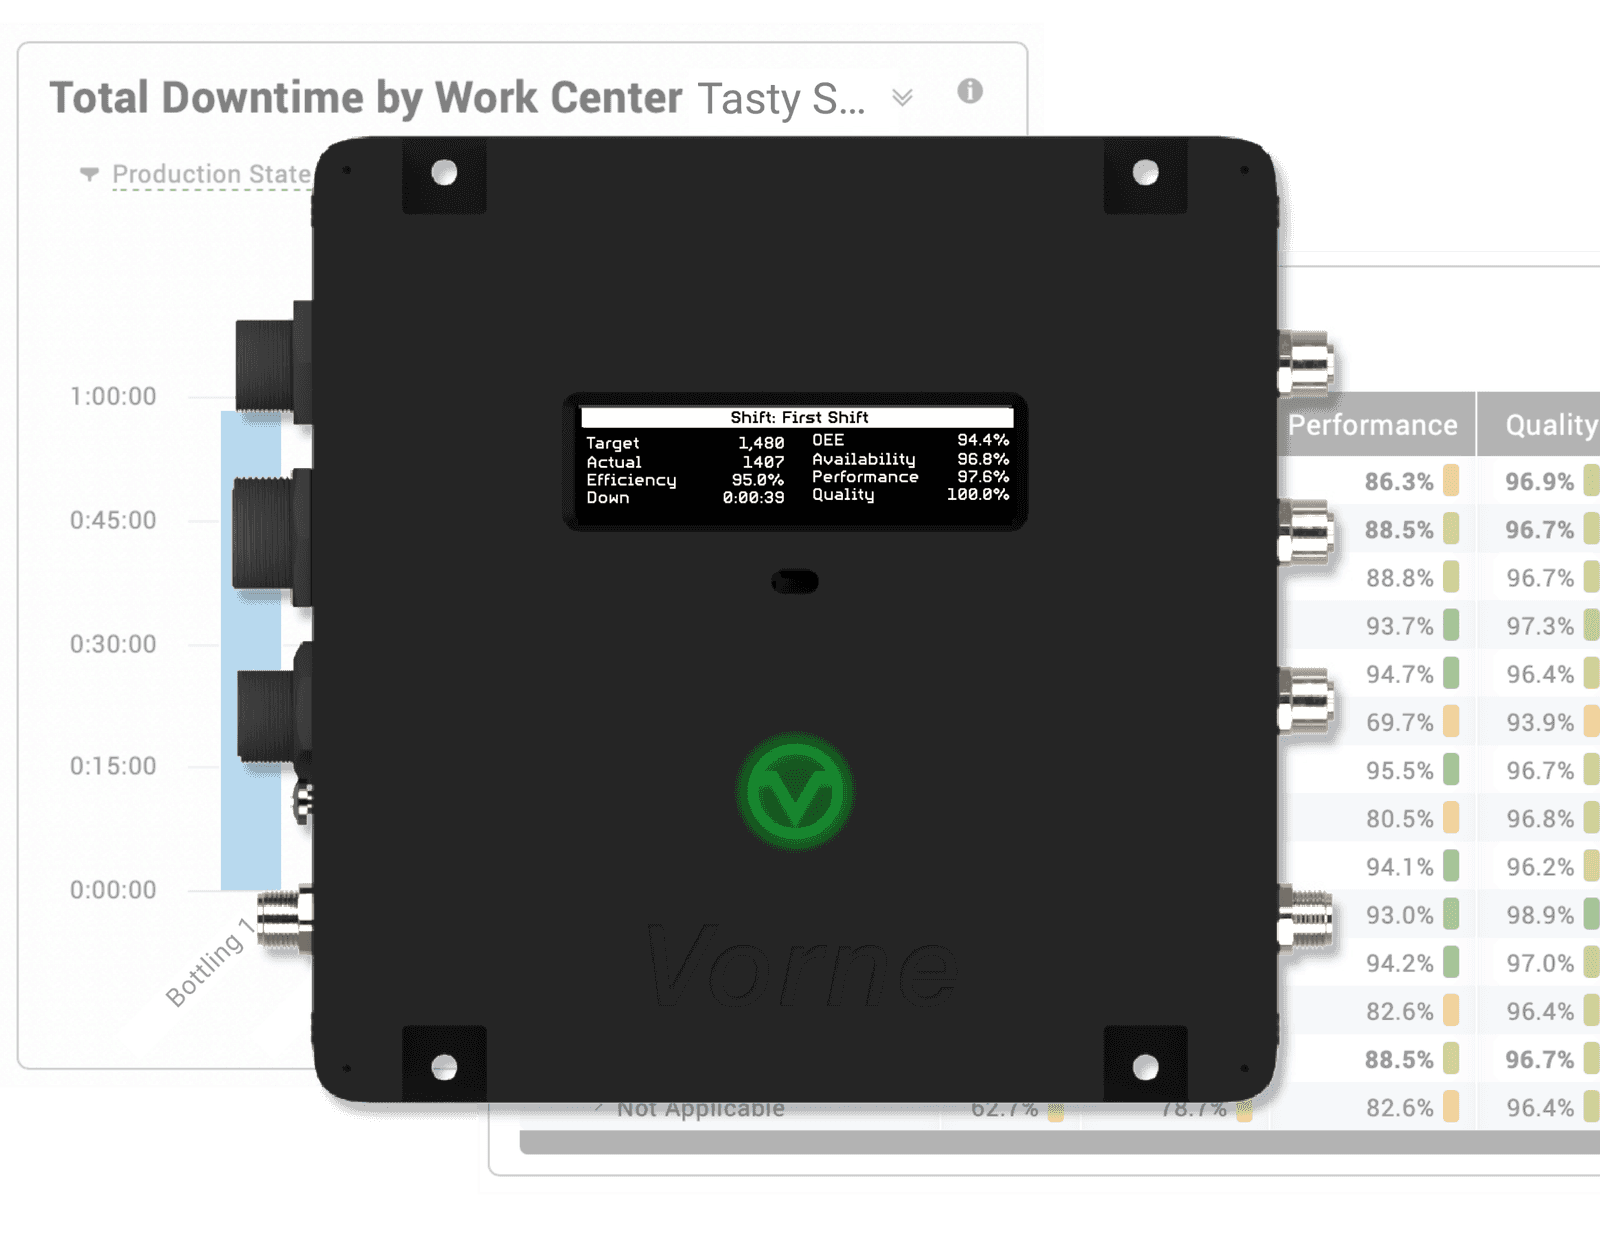

What Is OEE Software?
OEE is the gold standard for measuring manufacturing productivity and is an essential part of any manufacturing improvement program.
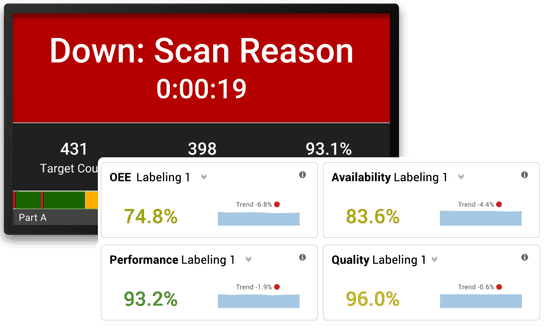
OEE software can leverage IoT devices to make it easier than ever to accurately track, analyze, and improve OEE (Overall Equipment Effectiveness) across all of your equipment.
The best OEE software solution goes beyond automating the measurement of OEE and provides you with tools to understand and address your underlying manufacturing losses such as:
- Downtime
- Speed Loss
- Rejects
- Small Stops
- Changeover Inefficiencies
- Quality Defects
- Hidden Factory
Monitor your OEE. View your production at a glance. Reduce downtime.
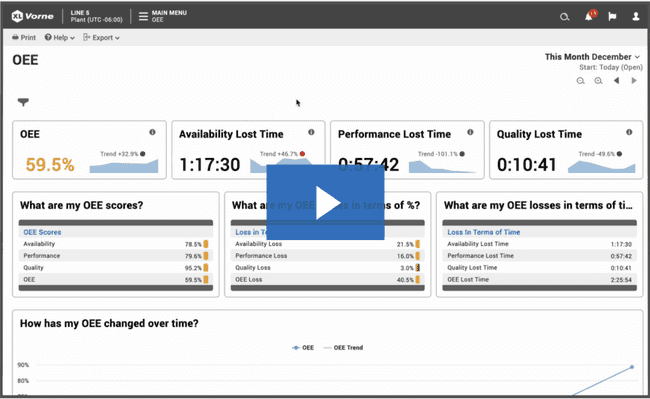
Play VideoHow OEE Software Works
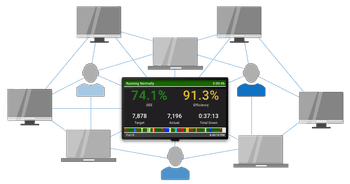
OEE Software is best paired with an IoT device to provide one connected platform for data collection and tracking, port that data to displays and/or networks, and distribute via visualizations and reports for analysis and action. It’s a simple five step process!
Step 1: Data Collection
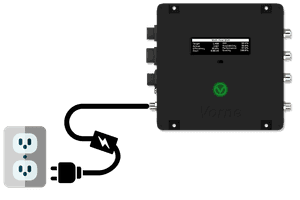
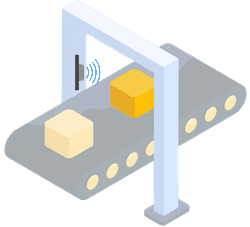
By connecting just two or three sensors to your production line, the Vorne OEE software system automates the collection of essential production data, such as downtime, cycle times, and rejects. This eliminates manual data entry and human bias, ensuring accuracy and consistency.
Step 2: Real-Time Monitoring
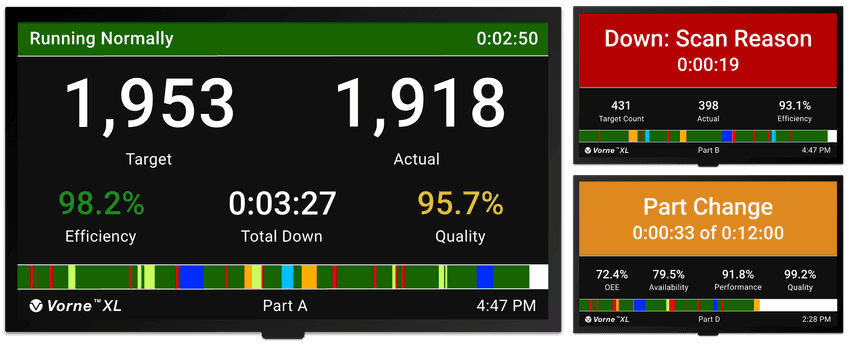
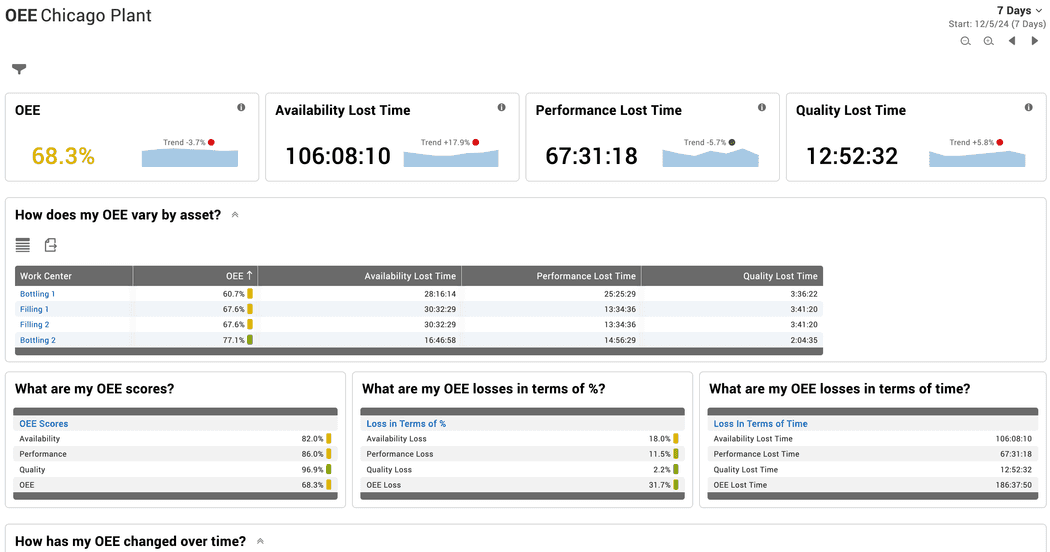
OEE software provides real-time visibility into your manufacturing process, enabling your team to address issues as they happen. Plant floor scoreboards and real-time reports keep operators informed and focused on meeting their shift targets.
Step 3: Data Analysis
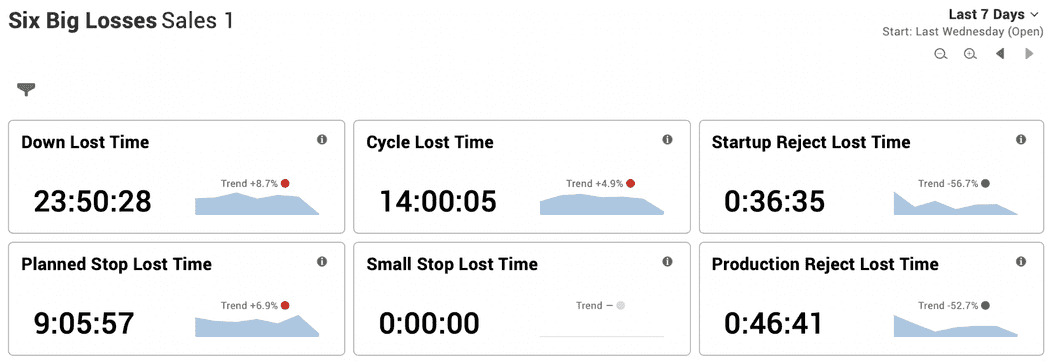
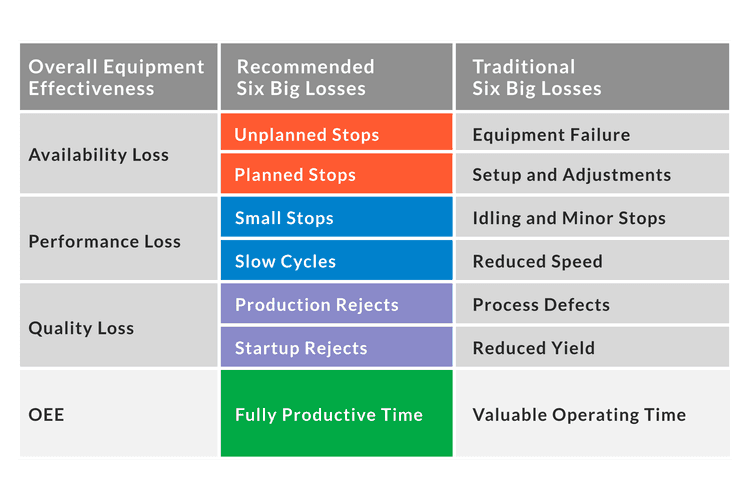
Data is automatically categorized as key metrics like Availability, Performance, and Quality, as well as the Six Big Losses. These metrics instantly highlight inefficiencies and uncover opportunities for improvement - most of the analysis is already done for you!
Step 4: Reporting and Visualization
Vorne OEE software offers built-in reports and customizable dashboards, giving teams access to over 140 metrics and detailed insights into production trends. Historical data storage ensures that you can analyze performance over time and benchmark progress.
Step 5: Continuous Improvement
With insights from OEE software, your team can shift its focus from data collection to taking meaningful actions that improve your manufacturing process. Tools like shift-based tracking, Pareto charts, and alerts make it easy to prioritize and resolve your biggest production challenges. Monitor how implemented actions impact your KPIs, and adjust accordingly.
What OEE Software Tracks
OEE software tracks the essential metrics that drive manufacturing productivity, and it empowers teams to improve upon them — especially when aligned with key performance indicators that matter most on the shop floor:
OEE Metrics
- Downtime events
- Speed loss
- Rejects and defects
- Availability
- Performance
- Quality
- Six Big Losses
- Shift timeline
- Production trends
- Hidden Factory
- TEEP (Total effective equipment performance)
OEE Improvements
- Downtime reduction
- Production speed and efficiency
- Quality of outputs
- Equipment utilization
- Real-time decision-making
- Productivity across shifts
- Changeover efficiency
- Visibility into manufacturing losses
- Benchmarking accuracy
- Long-term production trends
- Long-term capacity planning
- Operator and team target alignment
The Benefits of OEE Software
Improved Accuracy: OEE and Downtime
Achieve more accurate measurements of OEE and the underlying factors of Availability, Performance, and Quality by automating data capture.
For example, companies are often shocked when they discover their true downtime and how much time is lost to slow cycles and small stops.
Real-Time Data
Provide your team with real-time loss information so they can address these losses during the shift – in time to change the outcome of that shift. We don’t recommend focusing operators on the overall OEE score during the shift as it does not provide any actionable information about what to address within the shift.
It is better to focus on the underlying losses and provide operators with a takt-based shift target where 100% efficiency means that they are winning the shift. Simple and effective.
Loss Analysis
From a practical perspective, OEE is less important than the underlying losses. Why? Because knowing your losses is fundamental to driving improvement.
For example, a Six Big Loss analysis is a logical extension of OEE that is easily delivered by OEE monitoring software.
Benchmarking
Companies love to benchmark, which is very easy with OEE software. However, we recommend you do so with caution. There are two types of comparative benchmarks – space-based and time-based.
With space-based benchmarks, you compare multiple assets within the same time frame. Comparing OEE across different divisions, sites, assets, or products can be interesting, but is not likely to lead to actionable insights. If you are going to compare OEE scores, be sure that you are comparing the same equipment, running the same product under similar conditions.
With time-based benchmarks, you compare a single asset to itself over time, which is the preferred form of OEE benchmark. Use OEE as a tool for improvement by trending OEE over time for a given asset or product.
OEE Software Success Stories
Historical Perspective
Historical trends are extremely valuable to help understand the context of your OEE score. Remember - the best OEE score is one that is improving!
Dimensional analysis, such as by part, team, and shift should be easy with OEE software and provides a much deeper understanding of your OEE data.
Capacity Analysis
A closely related metric to OEE is TEEP (Total Effective Equipment Performance), which provides insights into the true capacity of your manufacturing operation. TEEP is calculated as OEE x Utilization.
The flip side to TEEP is Hidden Factory, which is the untapped capacity of your manufacturing plant (the maximum amount of additional production that can be unlocked without capital investment). Make sure your OEE software also measures TEEP.
5 Ways to Get the Most Out of Your OEE Software
While there are many different OEE Software platforms, there are also some universal truths to help you succeed.
1. Choose Simplicity
When systems are hard to use and hard to maintain, people just stop using them. We talk to many people who are unable to get the data or reports that they need from their system because it’s too complicated. We also talk to many people who are determined to capture every bit of information in their OEE system and then are overwhelmed by the sheer amount of data in front of them, which is usually quickly followed by problems with accuracy because the focus is on quantity over quality.
Select an OEE software solution that provides you with easy access to your data. Measure OEE only at the constraint of each manufacturing process, define no more than 25 down reasons for operators, and make it easy for them to enter reasons. Make sure the software enables operators to log reasons after the process has started running again so they can focus on what is most important – getting the process back up and running.
A good starting point for data is what we call the OEE gold standard, which is to measure OEE with an additional breakdown of OEE loss categories into the Six Big Losses and a detailed breakdown of OEE Availability losses into Downtime Reasons.
2. Create an OEE Rulebook
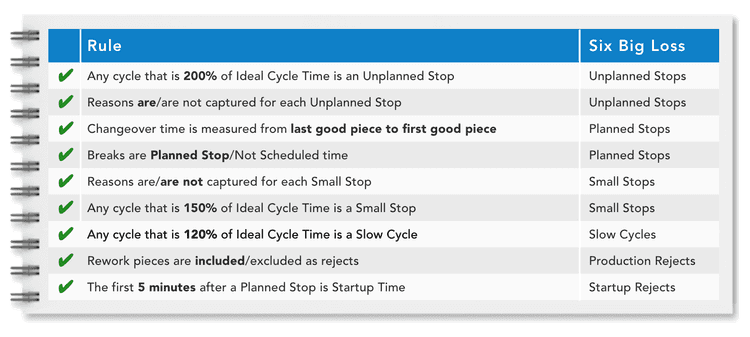
Creating an OEE rule book is especially important for larger companies. There are a handful of decisions that are very important to document and consistently apply across lines and plants to ensure your data is accurate and comparable.
The following decisions will affect your OEE score:
- Will team break times be counted as planned production time? Most companies choose no.
- Will changeovers be counted as planned production? Most companies choose yes (and should).
- Are pieces that require rework counted as defects? Most companies choose yes (and should).
The following decisions will help correctly and consistently allocate losses between Availability and Performance but will not change your top-level OEE:
- When is a changeover complete? Many companies choose when the first good piece is made. Others choose when the process is running.
- What differentiates a small stop from a down event? Many companies choose to base this on a multiplier of the Ideal Cycle Time so the threshold appropriately adjusts with different parts and cycle times.
Even better – plan from the start to measure the Six Big Losses and establish rules accordingly.
3. Establish Accurate Ideal Cycle Times
By far the most frequent problem we see when auditing OEE scores is inaccurately set Ideal Cycle Times. This can dramatically affect your OEE score. The problem often starts with companies deciding to use budget or standard times from their ERP system that are designed for scheduling and already include allocations for lost production time. The Ideal Cycle Time should have zero allocations for losses. It represents the absolute fastest speed that the process can run (sometimes referred to as the nameplate capacity or design speed).
Make sure your OEE software enables you to audit your Ideal Cycle Times by easily comparing the Ideal Cycle Time and Run Cycle Time with the granularity of each run event. Also verify that you can associate each part with a specific Ideal Cycle Time and that you are alerted if OEE Performance is greater than 100% for a given part run (a sure sign that the Ideal Cycle Time is set too high).
4. Set Achievable OEE Goals
Your OEE score shows you how close you are to perfect production. 100% OEE means you are manufacturing only good parts, as fast as possible, with no downtime. But on its own, your OEE score tells you nothing about what you need to improve and where you should focus. The true value of OEE comes from understanding and acting on the underlying losses: Availability Loss, Performance Loss, and Quality Loss. These losses tie directly to the Six Big Losses, which provide an excellent framework for understanding and improving productivity. Focus on addressing these losses and your OEE will improve naturally.
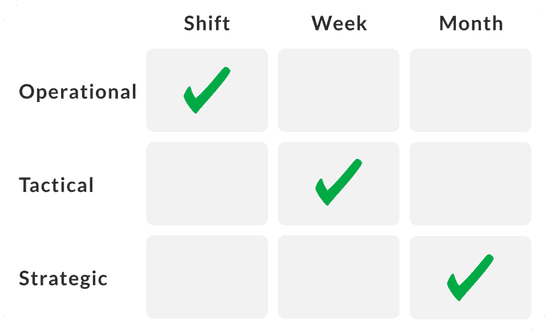
But there is another important step in the chain – establishing the right focus at the right levels.
- Operators focus on what they can improve in the next few hours. Get the line to speed. Quickly react to down events. Meet the changeover target.
- Supervisors focus on driving improvement across days or weeks. Analyze a problematic part. Set shift targets. Use data to be proactive – not reactive.
- Leadership focuses on change that spans months or longer. Launch a project. Set goals. Compare investment to results.
Make sure to include all levels of your company right from the start. One approach is to apply a structured improvement process to your OEE project.
5. Start with Your Shift Meeting
As soon as you are up and running with your OEE software, start using the data. A great place to start is improving the effectiveness of shift meetings by basing them on accurate loss information.
Make sure your OEE software includes built-in shift reports like the one shown so you can get started right away, and that it allows you to modify those reports so over time you can continue to refine them to best match your needs.
To maximize the impact of shift meetings, choose OEE software with:
- Built-in shift reports
- Customizable dashboards
- Automated alerts and email reports
OEE Software FAQs
You asked, we answered.
Get Started with a Free Trial
No commitment, no recurring fees, and see results in days.
The Vorne XL Productivity Appliance™ is a complete production monitoring solution. It includes a full suite of OEE software – including every feature described and pictured on this page and much, much more. XL provides the full benefits of OEE software with an unmatched combination of low price, fast deployment speeds, large installed base, and depth of features.
While Vorne XL can be up and running in as little as eight hours, getting the most out of its features takes a bit more time. That’s why we offer a free 90-day trial. We are very happy to offer the opportunity for you to test XL in your plant to see how it works on your line and integrates with your current systems before committing to a purchase!
Our trial process is proven - 92.8% of companies that try XL, buy XL. There are 42,000+ XL installations across 45+ countries and most started with a 90-day free trial.


