Production Scoreboards

What Are Manufacturing Scoreboards?
Manufacturing scoreboards display key production information for your plant floor team so that they have access to accurate real-time data upon which to base their decisions. Scoreboards can be as simple as a light indicating production state based on color, or as sophisticated as an electronic display showing multiple contextual metrics in real time.
Why Use Production Scoreboards?
Every day, companies strive to find better ways to eliminate waste and increase productivity in their manufacturing operations. One of the easiest and fastest ways to make gains is to focus your plant floor team on specific metrics that are proven to drive improvement in manufacturing productivity (e.g., Overall Equipment Effectiveness, Down Time, Changeover Time, First Pass Yield, and Efficiency). These types of metrics are typically referred to as KPIs (Key Performance Indicators).
Well-chosen KPIs that are widely communicated and consistently reinforced can be very effective in transforming a group of individuals into a high-performance team. Production scoreboards in manufacturing are a proven tool for communicating and reinforcing such KPIs. Scoreboards create focus, communicate information, and encourage your production teams to “win their shift”.

Types of Production Scoreboards
There are three common types of scoreboards used in manufacturing:
| Type | How It's Used |
|---|---|
| Andon Boards | The simplest type of production scoreboard. Typically a stacklight that communicates the current equipment state. For example, green, yellow, red, and blue lights may communicate whether the equipment is running well, running poorly, down, or in a changeover condition. Flashing lights convey increased urgency. Andon boards are a very effective way of drawing attention to specific equipment. They are simple and inexpensive, but they are also very limited in the information they convey. |
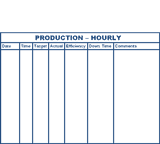
| Whiteboard | Portable (on wheels) or fixed (wall-mounted) writable boards where KPIs and other information are periodically updated. Whiteboards may be updated at the start of each day, at the start of each shift, or hourly (optimal). Typical information that is posted includes counts, rates, down time, and targets. Information is not real-time but can influence shift performance very effectively when updated hourly. Whiteboards convey a lot of information, but the information needs to be manually captured and updated, is not real-time, and is not viewable from a distance. |
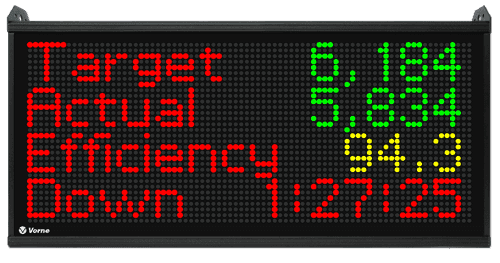
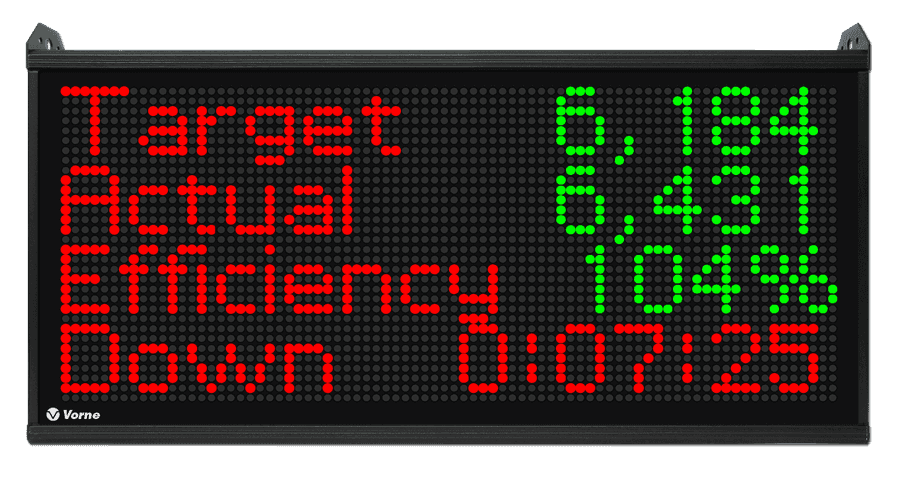
| Visual Display | Plant floor electronic displays that convey KPIs and other important information. The most effective visual displays are dynamic and take full advantage of their dynamic nature by:
|
How to Use Scoreboards in Manufacturing
A very effective way to use scoreboards is to communicate three types of information:
| Information | Conveys | KPI |
|---|---|---|
| Expectation | Where should we be? | Target |
| Performance | Where are we? | Actual |
| Achievement | How are we doing? | Efficiency |
Expectation conveys information to your team about where they should be at any given point of time. Setting expectations lends itself well to SMART goals (Specific, Measureable, Achievable, Relevant, and Time-Specific). An effective way to set expectations for manufacturing lines is to display a Target Count (driven by Takt Time). Target Count is a real-time, self-updating KPI that communicates how many good parts should have been manufactured at any given point of time (typically restarted from zero with each new shift).
Performance conveys information to your team about where they actually are at any given point of time. An effective way to communicate performance for manufacturing lines is to display Good Count. In general, match the units of your performance metric to the units of your expectation metric (e.g., if your expectation metric is measured in counts show the current count; if your expectation metric is measured by rate show the current rate).
Achievement conveys information to your team about how well they are doing – how well their performance correlates to expectations. Achievement is where you clearly communicate to your manufacturing team whether they are winning their shift (whether they are meeting or exceeding expectations). An effective way to convey achievement for manufacturing lines is to display Efficiency (the ratio of Actual to Target, presented as a percentage).
Remember – the goal of using manufacturing scoreboards is to influence behavior and drive action on the factory floor. With that in mind, plant floor scoreboards are most effective when they are real-time. After all – a scoreboard is not a report. It's not a tool for deep analysis. It's a tool for instantly conveying to your plant floor team how well they are doing – whether they are “winning their shift”.
You have good people, and good people are capable of achieving great results. Especially when they have the right information and focus to drive effective actions. Production scoreboards provide the information and focus that leads to effective actions – and ultimately to improved results. Set expectations and unleash the competitive spirit of your employees. Everyone likes to win. Use scoreboards to make it easier for your plant floor employees to win their shift!
Production Scoreboard Comparison Chart
The following selection chart highlights some of the many advantages of using the Vorne XL Productivity Appliance™ as a production scoreboard. We like to think of XL as the ultimate plant floor scoreboard!
| Advantage | Andon | Whiteboard | Vorne XL Productivity Appliance™ |
|---|---|---|---|
 |  |  | |
| Affordable | ✔ | ✔ | ✔ |
| Highly Visible | ✔ | ✔ | |
| Engages Operators | ✔ | ✔ | ✔ |
| Automates Data Capture | ✔ | ||
| Real-Time Information | ✔ | ✔ | |
| Historical Analytics | ✔ | ||
| Browser-Based Reports | ✔ | ||
| Multiple KPIs | ✔ | ✔ | |
| Downtime Alerts | ✔ | ✔ | |
| Slow Running Alerts | ✔ | ||
| Changeover/Break Timers | ✔ | ||
| Count Metrics | ✔ | ✔ | |
| Rate Metrics | ✔ | ||
| Cycle Metrics | ✔ | ||
| Production Time Metrics | ✔ | ||
| OEE Metrics | ✔ | ||
| Six Big Loss Metrics | ✔ | ||
| TEEP/Capacity Metrics | ✔ | ||
| Target Metrics | ✔ | ✔ |

