Improve Manufacturing Productivity

Production Improvement
The essence of improving manufacturing productivity can be summed up very simply as:
- Accurately capture information that identifies your losses (Information)
- Use that information to identify your priorities (Focus)
- Take thoughtful, thorough, and sustained action (Action)
This “essence” is reflected in all three of the well-known improvement processes: Lean Manufacturing, Theory of Constraints, and Six Sigma. The type and depth of information may vary, and there may be considerable differences in the types of actions that are taken and how those actions are prioritized, but Information, Focus, and Action are a common element of all three processes.
There is another common element in all three of these comprehensive and holistic improvement processes – they are not easy to master. There's a lot of well-written and insightful theory, but much less in the way of practical tips and insights. As a result it can be especially difficult for companies to know where to start. So while you are evaluating the large-scale options, we have hand-picked three of our favorite strategies for delivering quick wins using the simple and effective IDA (Information, Decision, and Action) model.
What Is Manufacturing Productivity?
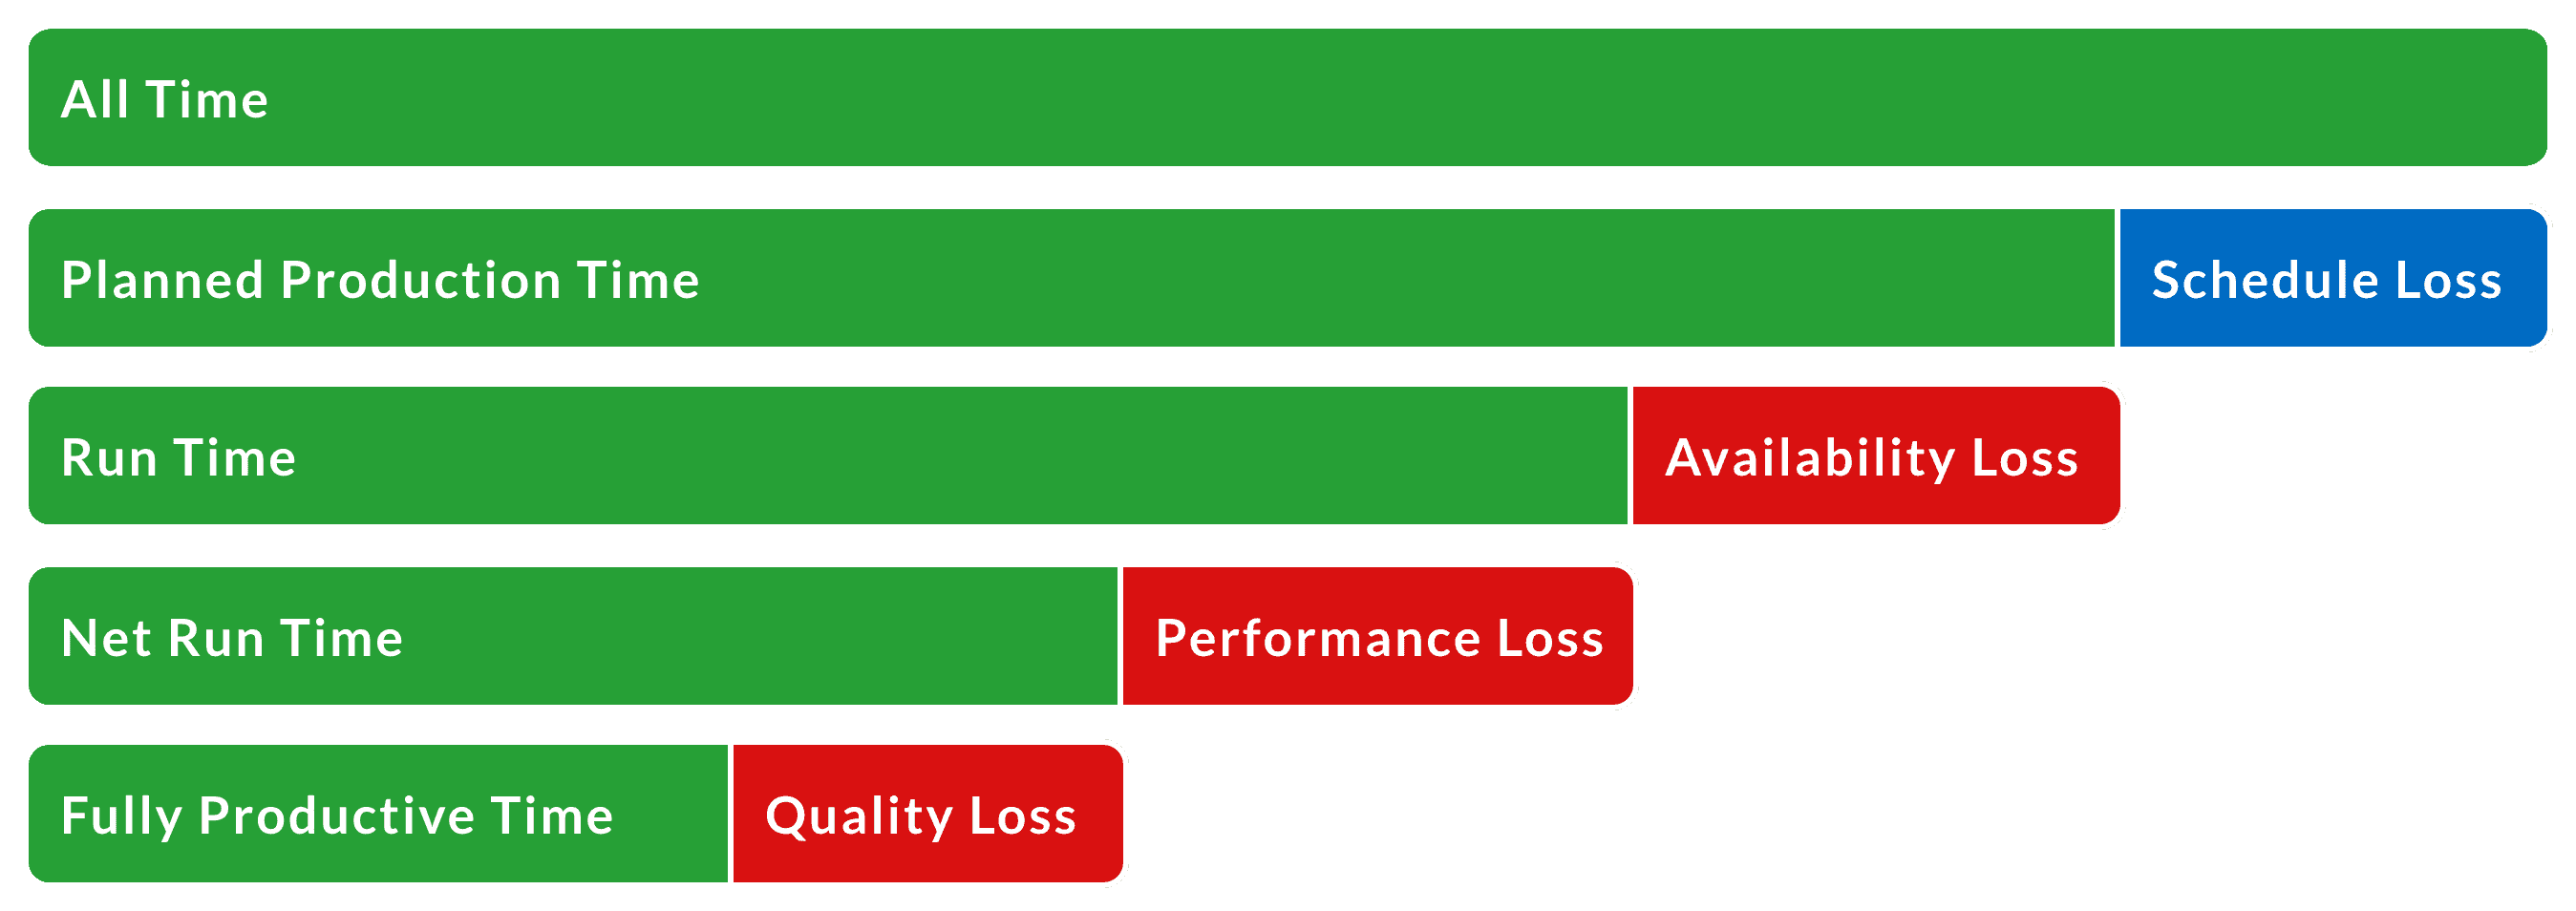
TPM (Total Productive Maintenance), which is one of the most important elements of Lean Manufacturing, includes a particularly useful productivity metric, known as OEE (Overall Equipment Effectiveness). OEE measures the percentage of Planned Production Time that is truly productive. An OEE score of 100% represents Perfect Production: manufacturing only good parts, as fast as possible, with no down time.

OEE is calculated from three underlying factors: Availability, Performance, and Quality. Each of these factors represents a different perspective for how close your manufacturing process is to Perfect Production.
| Loss Type | Description |
|---|---|
| Availability Loss | Includes all events that stop production for an appreciable amount of time (usually several minutes). Examples include equipment failures, unplanned maintenance, material shortages, and changeovers. |
| Performance Loss | Includes all factors that cause the process to operate at less than the maximum possible speed when running (including both slow cycles and small stops). Examples include machine wear, jams, substandard materials, and misfeeds. |
| Quality Loss | Includes productivity lost from manufacturing parts that do not meet quality standards after the first production pass (similar to the concept of first pass yield). This includes both scrap and parts that require rework. |
In order to accurately measure progress in improving manufacturing productivity it is important to create a clearly defined standard for measuring productivity and consistently apply that standard, both over time and across equipment. We recommend the following definition (your company may have different standards for what is included in Planned Production Time and Not Scheduled Time, which is fine; the most important thing is to clearly define what is included in each):
OEE is the standard metric for measuring the effectiveness (productivity) of manufacturing processes. It is measured at the constraint step of each process. OEE includes changeovers, planned maintenance, and meetings (these are treated as Planned Production Time; they reduce OEE). OEE does not include breaks, lunches, and meetings (these are treated as Not Scheduled Time; they have no effect on OEE).
Best Practices for Production Improvement
As mentioned earlier, there are three well-known, well-established, and proven improvement processes: Lean Manufacturing, Theory of Constraints, and Six Sigma. Each is traditionally viewed as a holistic process and each has a different focus.
Lean Manufacturing focuses on the relentless elimination of waste from manufacturing. Waste is defined as any activity that does not add value from the customer's perspective. According to research conducted by the Lean Enterprise Research Centre (LERC), fully 60% of production activities in a typical manufacturing operation are waste – they add no value at all for the customer.
Theory of Constraints (TOC) focuses on increasing throughput to improve profitability. In manufacturing, TOC identifies the constraint (bottleneck) of the process and systematically improves that constraint until it is no longer the limiting factor on throughput (it then moves on to the next constraint). One of the most appealing characteristics of the Theory of Constraints is that it inherently prioritizes and focuses improvement activities. The top priority is always the current constraint. In environments where there is an urgent need to improve, Theory of Constraints offers a highly focused methodology for rapid improvement.
Six Sigma focuses on reducing process variation with a primary goal of identifying and eliminating the causes of defects. It relies extensively on formal processes and statistics and emphasizes process standardization with formal training to engage employees and develop technical expertise (e.g., Six Sigma Black Belts).
Traditionally, manufacturers and consultants have tended to pick a single strategy at the expense of others. In recent years however, there has been more blending, creating hybrid disciplines such as Lean Six Sigma, TLS, and the Ultimate Improvement Cycle (UIC).
As mentioned earlier, it can be difficult to know where to start when embarking on a broad program to improve manufacturing productivity – it takes some time to evaluate the options and pick the approach that will work best for you. In the meantime, here are three of our favorite strategies for delivering quick wins.
How to Quickly Improve Productivity in Manufacturing
Three “quick win” strategies for improving manufacturing productivity are:
Accurately Identify Your Losses
Problem: We are not sure that we have accurate information about our manufacturing losses. As a result we may be working on the wrong things.
Strategy: Implement the gold standard for measuring manufacturing losses: OEE with a breakdown of OEE Losses into the Six Big Losses, and a further breakdown of OEE Availability Losses into Down Time Reasons. Add TEEP (Total Effective Equipment Performance) for insights on capacity.
Solution: XL tracks all losses to Perfect Production right out-of-the-box. All you need is:
- Two Sensors: In Count and either Good Count or Reject Count
- Ideal Cycle Time: The theoretical minimum time to manufacture one part
- Barcode Scanner: XL even generates barcode sheets for your operators
Voila! You get complete and accurate information on losses: OEE Losses, Six Big Losses, Down Time Losses, Cycle Losses, and Capacity Losses. Information is available both as real-time metrics and as historical trended analytics.
We highly recommend capturing a reason and duration for each Down Time incident to enable your team to effectively prioritize and focus. Start simple, with no more than 25 reasons, one of which should be ‘All Other Losses’. Remove reasons that aren't regularly used and add reasons as needed to ensure that ‘All Other Losses’ is not in the top ten losses.

Attack Your Top Losses
Problem: We want a simple way to focus and prioritize actions so they will have the greatest possible impact.
Strategy: Focus your actions on the top losses to the constraint step of your manufacturing process.
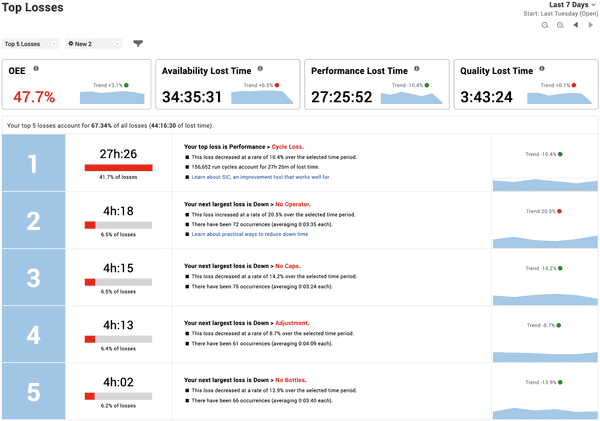
Solution: The XL Top Losses report instantly shows you important information about your largest losses. To decide where to focus your time and attention simply:
- Set the Date Range to Last 30 Days.
- Identify one loss within the top five that the team feels most confident they can improve.
- Agree on an improvement target and any external resources needed to reach that target.
Review progress by continuing to monitor the Top Losses report (especially trend information).

Apply Short Interval Control
Problem: We want our operators to be much more aware and proactive about improvement.
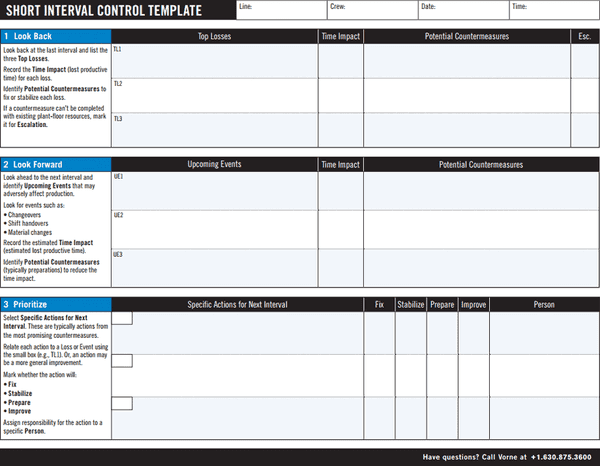
Strategy: Apply Short Interval Control (SIC). SIC leverages quick reviews of performance data during the shift to enable mid-course corrections and immediate small-scale fixes.
Solution: XL includes an integrated SIC Template and Top Losses report that makes it easy to:
- Look Back: Identify the top three losses, their impact, and potential countermeasures
- Look Forward: Identify upcoming events that may adversely affect production, their potential impact, and potential countermeasure
- Prioritize: Select specific actions for the next SIC interval


