Win the Shift

What Does It Mean to “Win the Shift” in Production?
Many operators don’t know the production target for their shift, or if they’re currently on-track to hit that target. They start the shift not knowing what a ‘win’ is, and leave not knowing if they ‘won’ or ‘lost’. We all like to go home knowing that we ‘won’ today, and when you set a target, then your team is far more likely to hit it!
A simple test: Go out to the factory floor. Find an operator. And ask two simple questions:
- “Do you have a production target for this shift?"
- "If so, how far ahead or behind this target are you, right now?"
If your operator can’t quickly and accurately provide this information, you have an opportunity to help them win their shift today. When your teams are regularly winning their shift, you will consistently win the week, month, and quarter.
This page provides a simple and effective way to help you set and beat your production targets.
Plan to Win with Real-Time Production Targets
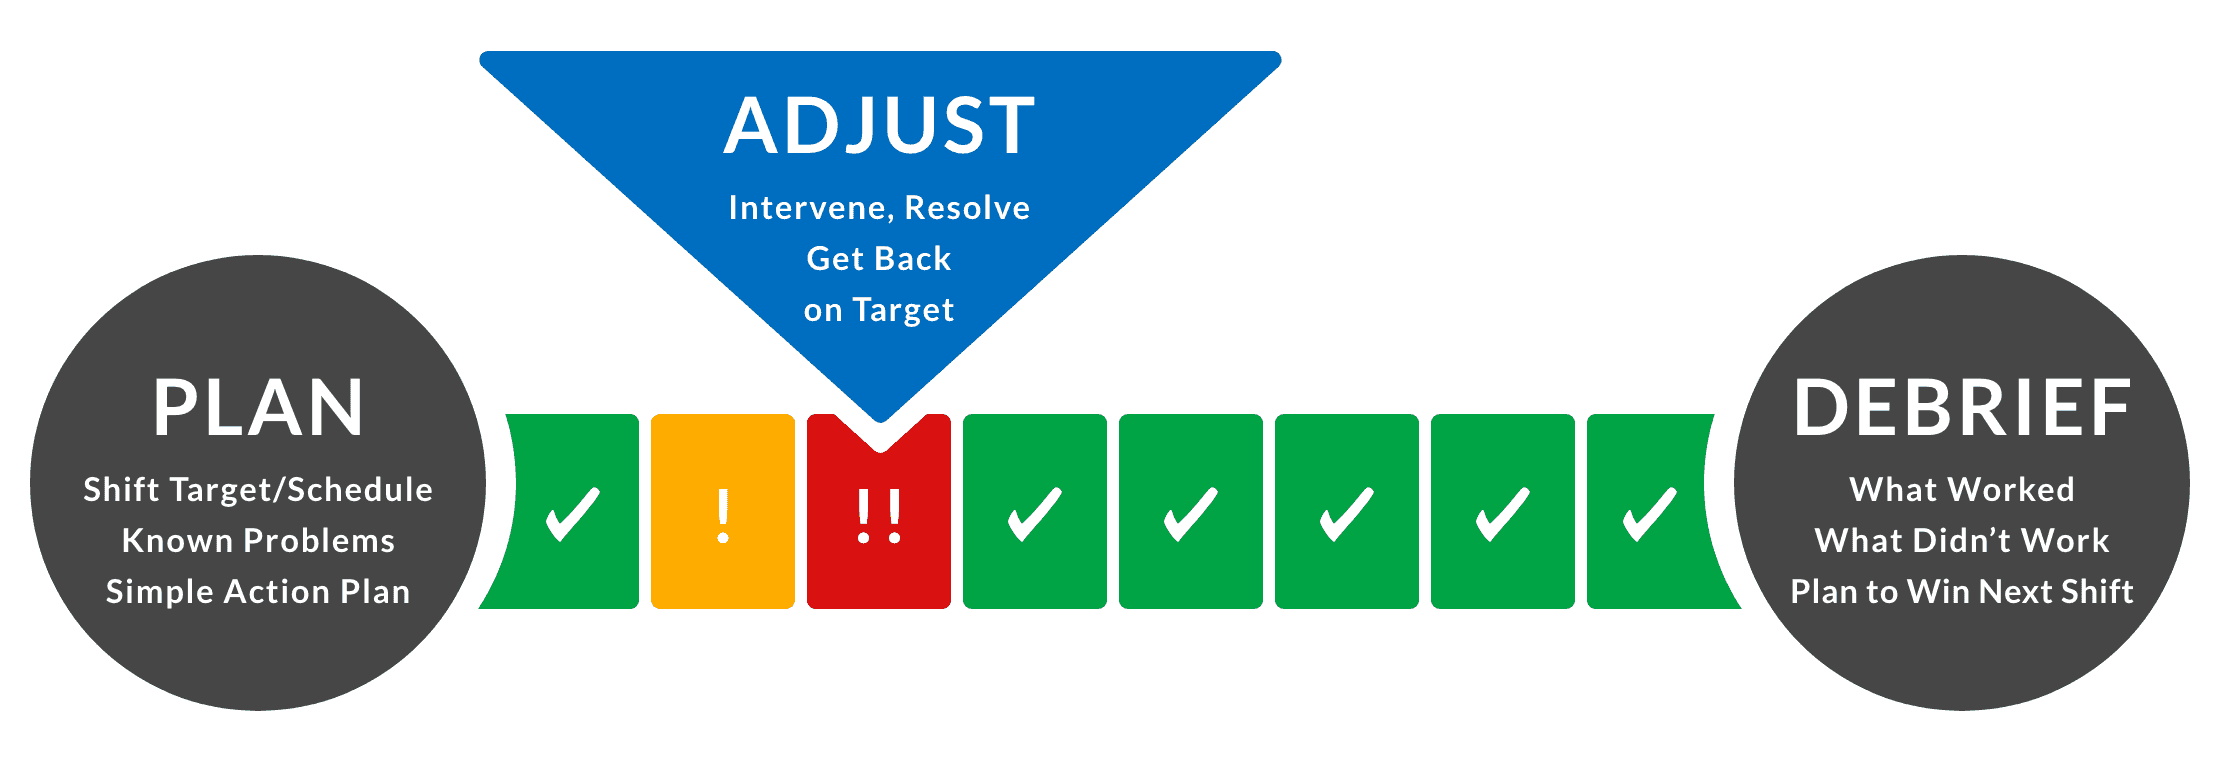
Your favorite teams don't win games by accident. Before each game they create a plan. The plan has contingencies if the play goes off-track. Then they execute the plan, and adjust the play as they go. The manufacturing version of this strategy is:

Plan
Start the shift with a quick (maximum 5-minute) stand-up meeting with the operators to:
- Agree on a specific shift target (e.g. pieces, pallets, pounds, packets, etc.).
- Identify known potential issues (e.g. changeovers, material changes, operator needing training).
- Identify any open problems from the last shift (e.g. unresolved breakdowns, material issues).
- Agree a simple action plan so that people know what to focus on, when to call for help, and who to call if they fall behind.
Adjust
Track production in real-time. If the team falls too far behind their target, intervene quickly to help them get back on-track. This might involve:
- Allocating engineering resources to a machine that’s having technical issues.
- Carrying out some on-the-job training if an operator is struggling.
- Resolving material issues that are causing running problems.
- Rebalancing the allocation of operators across machines.
For a more robust approach, consider implementing a Short Interval Control (SIC) process. Short Interval Control is a structured process for reviewing production every 2 or 4 hours to identify a small number of improvement actions.
Debrief
Many teams miss this important step and lose valuable information as a result. At the end of the shift – gather the team for a quick debrief. Capture what worked and what didn’t.
- Did the team hit their shift target?
- If they did, what should be repeated on the next shift (and briefed to people on other shifts)?
- If they didn’t hit their shift target, what should be done differently for the next shift?
Publish these actions in the team area and use them in your next Plan-to-Win session.
Hourly vs. Real-Time Production Tracking Boards
The biggest challenge that most teams face is – how do we accurately track production vs the target?
Manual Hourly Production Tracking Boards
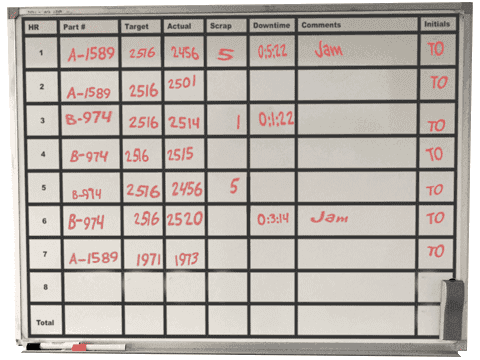
The traditional approach to monitoring production is to use an hour-by-hour whiteboard. Hour-by-hour or ‘Production Control’ boards are heavily featured in the Toyota Production System (TPS) as a way of visually managing production, balancing the schedule, and managing production flow.
A typical hour-by-hour board tracks the required hourly target and an accumulated hourly target, and compares these targets to the actual production and an accumulation of production for the entire shift.

There are three big challenges with hour-by-hour boards:
- Updates: If someone doesn’t manually update the board, the data is immediately out of date.
- Accuracy: If you run products at different speeds, it is hard to set a real target. Many teams use a target based on an average rate—that doesn’t create a true target.
- History: Once the board is cleaned…the data is gone forever!
Automated Real-Time Production Tracking Boards
Two great benefits from tracking production with an automated monitoring system is that it will be accurate (tracking products by-part), and that it will provide real-time feedback (either on the machine with a visual display, or on a computer as a dashboard).
We find that the best way to track production in real-time is to use a combination of metrics that we call “TAED”: Target, Actual, Efficiency, Downtime. These are:
- Target: Real-time count of good parts that should have been manufactured.
- Actual: Real-time count of good parts that actually were manufactured.
- Efficiency: Ratio of actual good parts to target good parts.
- Downtime: Downtime for most companies is the largest loss, and a component of OEE Availability.
By comparing Target to Actual, your team can pace production in real-time. They are winning the shift when the Efficiency is at 100% or more. At the end of the shift, the display could then provide instant feedback telling the team that they’ve beaten the target:

If you have multiple machines or processes, an automated system can provide a real-time dashboard for every machine. This will help your managers to allocate resources across the production floor to ensure that every team can win their shift.


